![]()
![]()
![]()
![]()

![]()
![]()
![]()
![]()
![]()
![]()
![]()
![]()
![]()
![]()
![]()
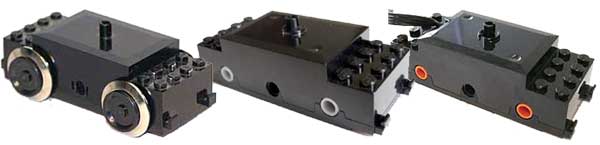
- On the left, the engine equipped with one of the three train motors. The battery pack powers train motor and is used as weight. This is a modified pack with only 4 NiMH cells, the train motor thus receives a 5V power allowing the train to run at medium speed. I avoided the use of PWM speed control, as the chopped current might have disturbed the measurements.
- On the middle car, the NXT (powered by Li-ion battery pack), the Power Meter sensor and the custom relay control board.
- On the left, a small car with a frictionless RCX rotation sensor allows to measure the distance travelled on the track.
- The speed of the PF train at the same load is significantly higher than the 9V train (+35%) and the RC train (+64%).
- The RC train and the PF train consumes more current than the 9V train, resulting in higher instantaneous power (+44%).
- But since the PF train completes the lap in the shorter time, the energy it consumes to travel a lap is lower than the 9V train (-17%) and much lower than RC train (-46%)
- +/- 23% for 9V train
- +/- 52% for RC train
- +/- 17% for PF train
- The PF train is 68% faster than the 9V train and almost three times faster than the RC train! Powered from only three NiMH cells, it is still faster than its competitors.
- Performance of the PF train comes with a cost: instantaneous power is significantly higher. But at a lower voltage it outperforms the other trains with less power.
- And if we compare the energy needed to perform one lap, PF train is 40% more efficient than 9V motor, and more than three times more efficient than RC motor!
- +/- 36% for 9V train
- +/- 90% for RC train
- +/- 15% for PF train
- +/- 27% for PF train
LEGO® Train Motors comparison
After testing the Power Functions train motor and seeing its improved characteristics compared to the RC train motor, it was time to do an application specific test! A NXT with Mindsensors PowerMeter sensor can be put on a train and monitor motor power consumption as it runs along the track.
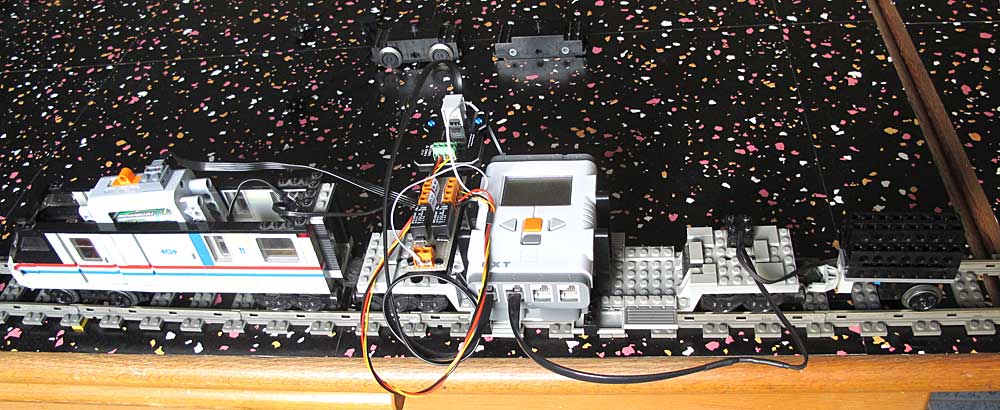
This photo shows the train with power monitoring equipment.
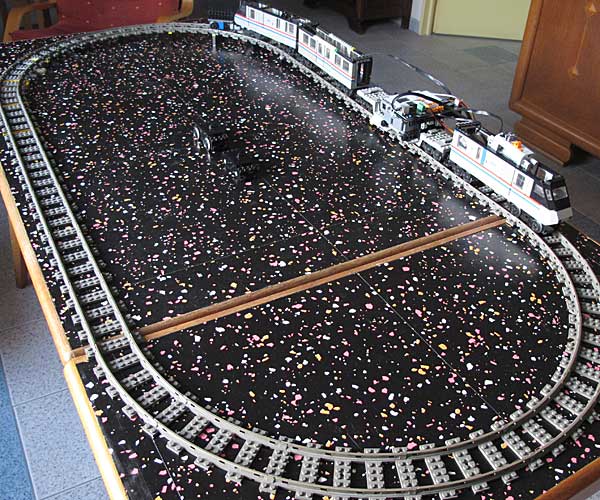
The track itself is a simple oval, with one of the curves raised (8 plates). Track length, measured in the middle, is about 3.45m. The tests were performed with two train lengths. The first is a lightly loaded train (just the three measurement cars). The second test adds two cars for more strain on the motor.
As the train runs, the NXT logs time, voltage, current and rotation sensor ticks. From these values an Excel spreadsheet derives travelled distance, train speed, instantaneous power and energy consumed.
Three car train test
You may download the test results Excel spreadsheet here.
|
9V train |
RC train |
PF train |
Lap time (s) |
6.71 |
8.23 |
5.01 |
Travelled (m) |
3.43 |
3.44 |
3.45 |
Average speed (m/s) |
0.51 |
0.42 |
0.69 |
Average voltage (V) |
5.40 |
5.33 |
5.38 |
Average current (A) |
0.11 |
0.16 |
0.16 |
Average power (W) |
0.59 |
0.85 |
0.85 |
Energy consumed (J) |
6.30 |
9.61 |
5.21 |
The table above summarizes the results. All the values are computed on one full lap.
|
If we have a closer look at the speed charts for the three motors, we see another strong point of the PF motor: the speed is much more steady despite load variation. In the chart we see the speed drop that occurs in the curves (increased friction). Of course, the speed drops even more in the raised curve. Speed variation is |
Five car train test
You may download the test results Excel spreadsheet here.
|
9V train |
RC train |
PF train |
PF train@3.6V |
Lap time (s) |
9.88 |
17.22 |
5.81 |
8.98 |
Travelled (m) |
3.44 |
3.45 |
3.45 |
3.44 |
Average speed (m/s) |
0.35 |
0.20 |
0.59 |
0.38 |
Average voltage (V) |
5.29 |
5.20 |
5.16 |
3.71 |
Average current (A) |
0.19 |
0.24 |
0.30 |
0.26 |
Average power (W) |
1.01 |
1.22 |
1.54 |
0.98 |
Energy consumed (J) |
12.70 |
26.40 |
7.72 |
7.83 |
The table above summarizes the results. All the values are computed on one full lap.
This time I performed a 4th test, with a reduced voltage on PF train. PF performance is still better than the other motors at a higher voltage, but power consumption is significantly lower.
The increased load emphasizes the differences between motors.
|
Here again speed variation under load is significantly lower for the PF train. RC train is almost stalled in the curves and only recovers in the downhill. Speed variation is
|


Data logging
The first logs I made with the PowerMeter showed weird spikes (see chart below) in voltage and current readings. Of course some noise is expected, but these spikes were highly improbable!. Then I noticed that the erroneous values occurred mainly when the expected value was near a multiple of 256. This makes me think (I may be wrong!) that this kind of error may occur if the processor inside the sensor updates the values during the time NXT reads high and low order bytes of the value.
Anyway, I solved the problem by discarding values that are too far away from previously read values.
![]() You may
download the NXC program used for the tests here.
You may
download the NXC program used for the tests here.
![]()
![]()
![]()
![]()
![]()
![]()
![]()
![]()
![]()
![]()
![]()
![]()
![]()
![]()
![]()